Analytics
See what's happening on the floor, live
Currently waiting, currently being served, average wait time, no-shows, cancellations, and total served — all updating in real time via a live connection, with historical trends you can filter by date range and, for chains, by location.
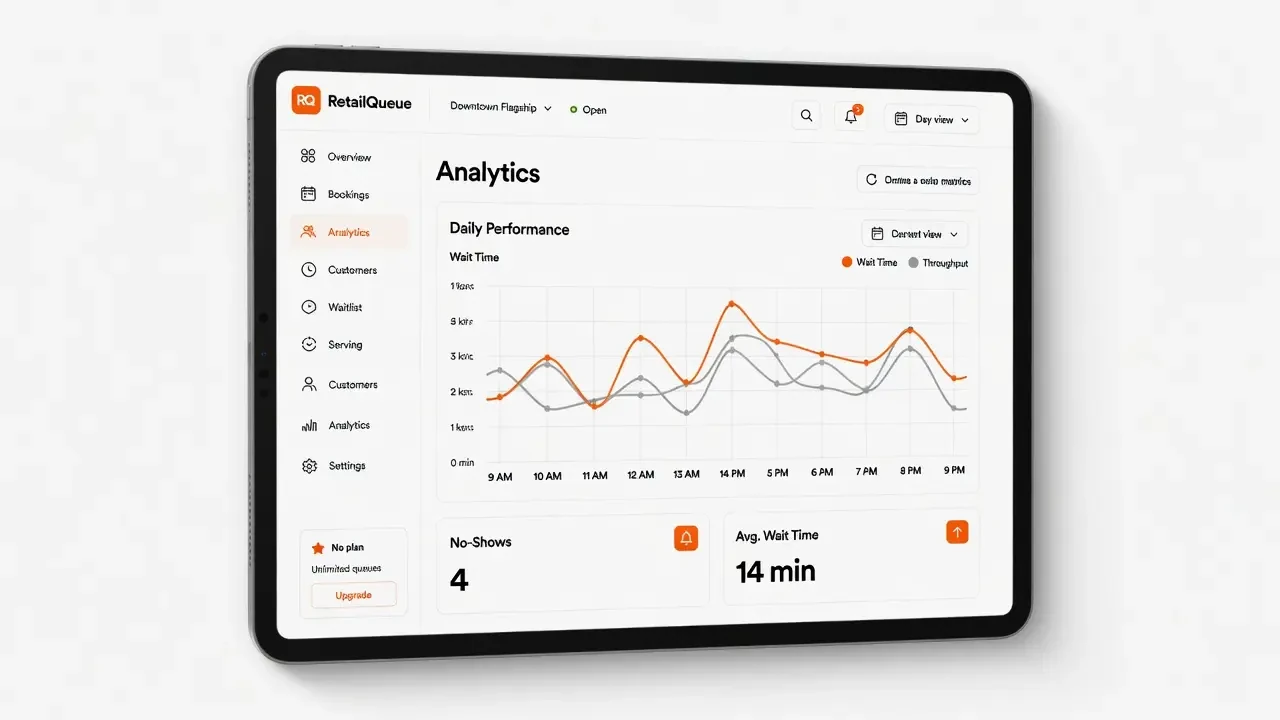
Live
dashboard counts, not an end-of-day report
Currently waiting and currently serving update as it happens.
CSV
export available for any date range, any time
Take the numbers wherever you need them.
1
toggle between a single branch and the whole chain
Same view, whichever scope you need.
Live
dashboard counts, not end-of-day reports
How it works
Live counts on the dashboard
Currently waiting and currently being served update instantly as customers join, get called, and are served — no manual refresh.
Historical trends on demand
Average wait time, average serve time, no-show rate, and cancellation rate are all available over any date range you choose, from today to a custom period.
Peak-time snapshots
See historical highs — like your busiest 9am on record — so you can staff appropriately ahead of time.
Location filters for chains
Multi-location accounts can view a single branch or an aggregated view across the whole chain with one toggle.
Why it matters
Staff before you're understaffed
Spot the patterns in wait times and no-shows before they become a recurring problem.
Prove the impact
Track wait-time reduction over time to see the concrete effect of moving off a paper waitlist.
Export what you need
Pull a CSV report for any period when you need the numbers outside the dashboard.
See the pattern before it's a problem
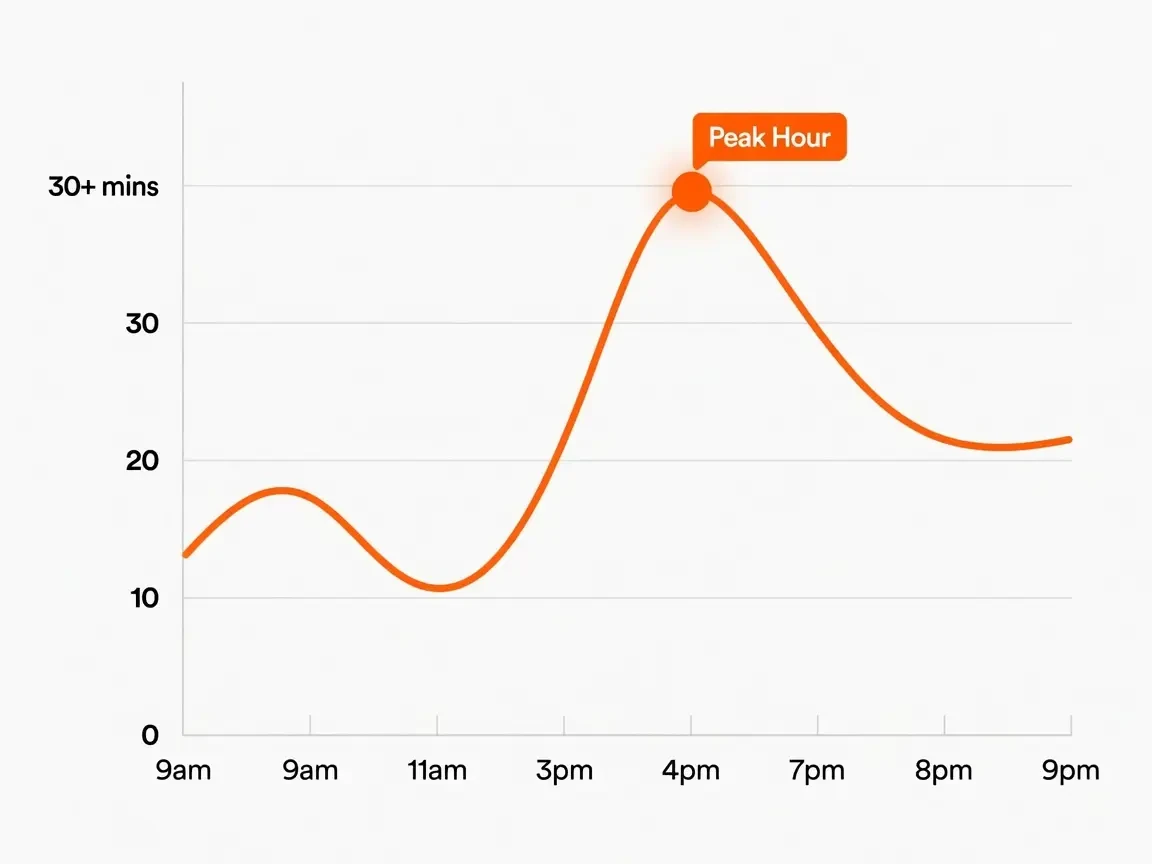
Average wait time, no-show rate, and cancellation rate are tracked continuously, not just totalled at the end of the day — so a slow Tuesday afternoon or a spike in no-shows shows up while there's still time to do something about it.
- Average wait and serve time over any date range
- No-show and cancellation rate tracked continuously
- Historical peak snapshots, like your busiest 9am on record
Numbers you can take with you
Every report can be exported as a CSV for any period, so the numbers aren't locked to the dashboard — pull them into a spreadsheet, a board deck, or whatever system your business already reports through.
- CSV export for waitlist, booking, and customer activity
- Any date range, from today to a custom period
- Same export format whether you run one location or twenty
What our customers say
“The analytics ended a staffing argument that had been going on for two years. Our real rush is 4-6pm, not Saturday morning.”
Tom Fletcher
General manager, Sports equipment store
“I export the no-show numbers every Monday. It's the first thing I check before I plan the week.”
Naomi Clarke
Practice manager, Dental clinic
“Watching the live count during a rush is oddly satisfying. You can see exactly when to open a second till.”
Oliver Grant
Duty manager, Department store